Weather Records and Their Role in Adjusting Odds for Cricket Matches and Horse Racing Events
Yves Powell · Aug 29, 2026
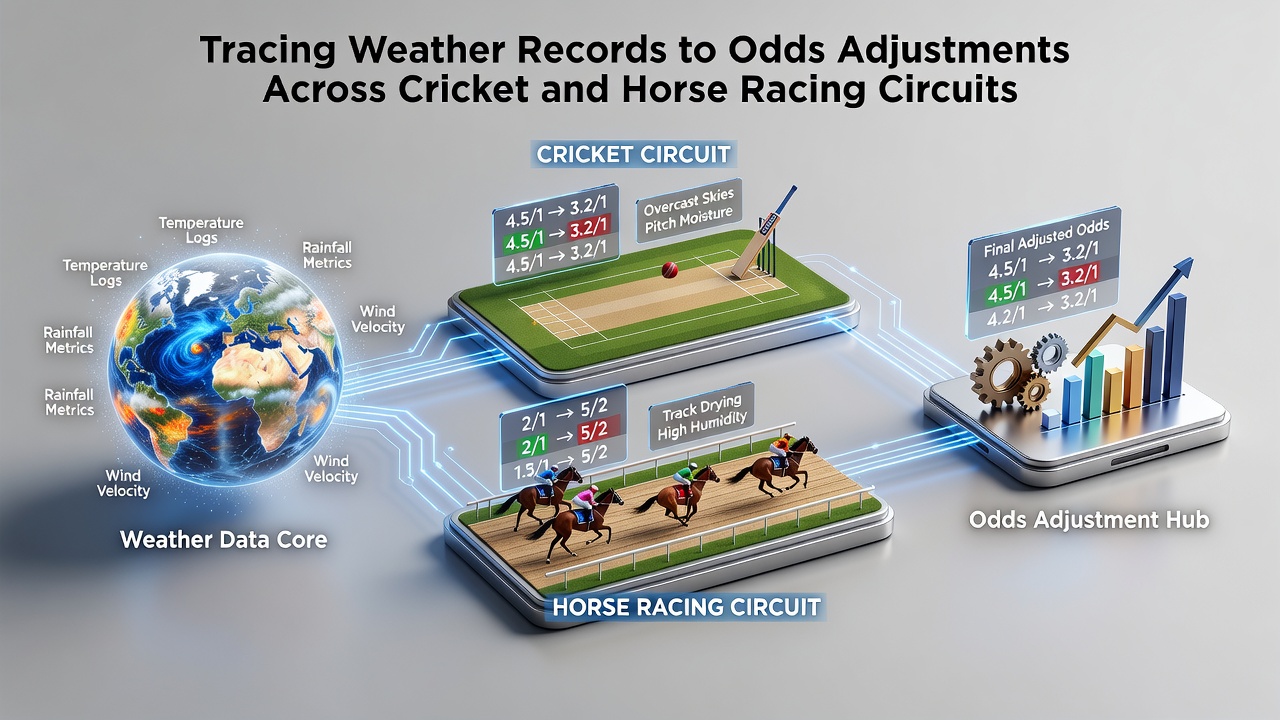
Weather Records and Their Role in Adjusting Odds for Cricket Matches and Horse Racing Events
Weather records have long influenced how betting markets set and revise odds in cricket and horse racing, where environmental factors directly alter playing conditions and performance metrics. Meteorologists and analysts track rainfall patterns, temperature fluctuations, and wind speeds to identify correlations with match outcomes or race results, and betting operators incorporate these datasets when recalibrating lines ahead of events.
Historical Data Integration in Cricket Markets
Cricket schedules span multiple climates, and limited-overs formats prove especially sensitive to precipitation because rain interruptions trigger revised targets under the Duckworth-Lewis-Stern method; operators therefore monitor long-term precipitation records from venues such as those used in the Indian Premier League or the Big Bash League. Figures from the Australian Bureau of Meteorology show that venues in eastern Australia record average August rainfall totals between 40 and 70 millimetres, and these values feed into pre-match probability models that adjust over-under totals on total runs or match winner odds.
Researchers at several universities have examined decades of scorecards alongside contemporaneous weather logs, revealing that elevated humidity levels above 70 percent correlate with reduced batting averages in day matches, while consistent crosswinds above 25 kilometres per hour increase the frequency of edges that carry to slips. Bookmakers adjust their algorithms to reflect these statistical shifts, tightening spreads on run totals when forecasts indicate conditions that historically suppress scoring.
Track Conditions and Racing Odds Adjustments
Horse racing circuits apply similar logic when surface conditions change with rainfall or temperature swings. Official going reports issued by bodies such as Racing Australia classify tracks from firm to heavy, and each classification carries documented win-rate differentials for various horse profiles. Data compiled by the Jockey Club in the United States indicates that horses with proven records on yielding ground improve their strike rate by roughly 12 percent when official readings move from good to soft, prompting odds compilers to shorten prices on those runners while lengthening quotes on speed-oriented animals.
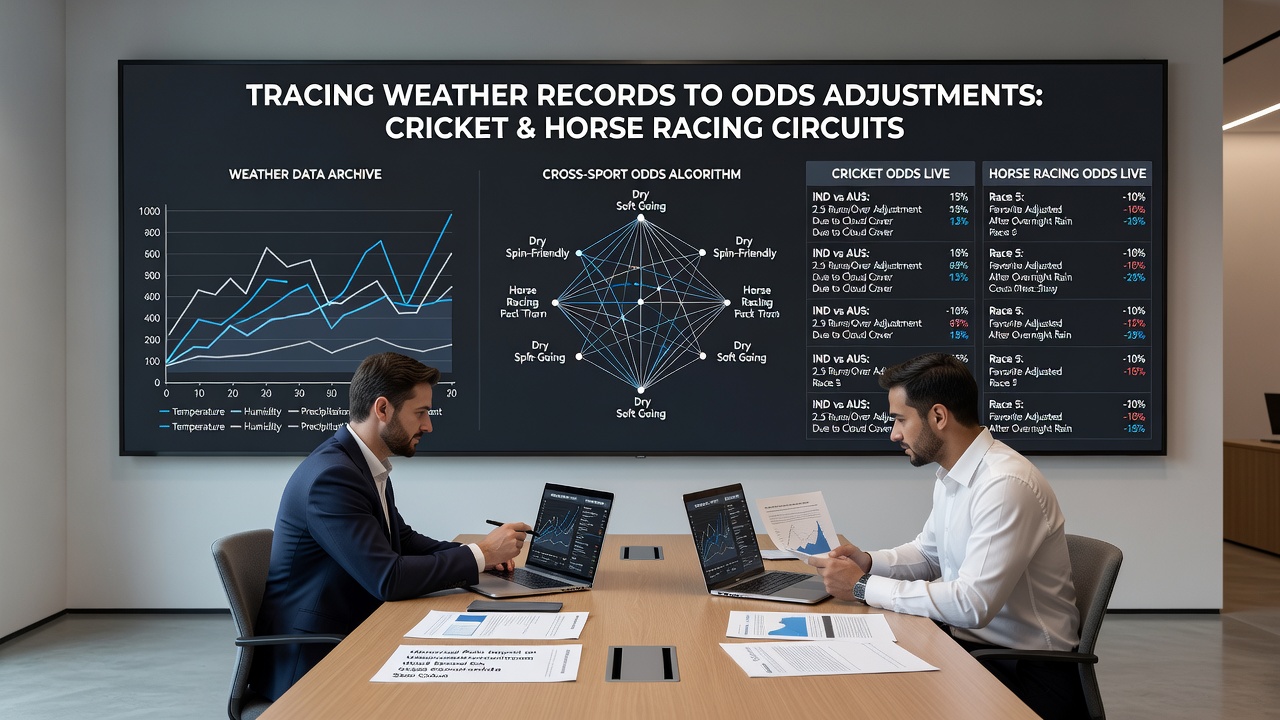
August meetings at tracks in the northern hemisphere often coincide with late-summer thunderstorms, and forecasters release updated precipitation probabilities that operators integrate into live betting platforms. When radar shows an approaching band of rain, markets on individual race winners and place getters move within minutes as traders recalibrate probabilities based on historical performance splits under similar moisture levels.
Forecast Accuracy and Real-Time Market Movement
Modern weather services supply granular forecasts at hourly intervals, allowing betting platforms to refresh odds continuously during the lead-up to an event. National meteorological agencies in both hemispheres publish verification statistics showing that 24-hour precipitation forecasts now achieve accuracy rates above 85 percent for major racing and cricket venues, and this improved reliability reduces the margin of error in pre-event adjustments. Operators that subscribe to these feeds can therefore move lines earlier and with greater precision than those relying on older, coarser models.
Case studies compiled by industry research groups illustrate the pattern: when a Test match venue in South Africa records unseasonal rainfall totals exceeding 30 millimetres in the 48 hours before the start, markets on the draw shorten measurably because historical data link wet pitches to slower scoring rates and higher draw probabilities. Similar patterns appear in racing when overnight temperatures drop below 10 degrees Celsius, prompting surface hardening that favours front-runners; odds on prominent pace horses contract accordingly.
Cross-Circuit Data Sharing Practices
Analysts working across both sports increasingly pool anonymised performance datasets with weather archives to build multi-factor models. These models weight variables such as soil moisture retention, grass length, and wind direction against past results, then output suggested odds revisions that human traders review before implementation. Regulatory frameworks in Australia and the United States require operators to maintain audit trails of such adjustments, ensuring that weather-derived changes remain transparent and defensible against claims of arbitrary movement.
Conclusion
Weather records therefore serve as a quantifiable input that links environmental conditions to measurable shifts in outcome probabilities across cricket and horse racing circuits. Operators that maintain robust connections to meteorological datasets can refine their pricing frameworks in line with documented historical patterns, while governing bodies continue to publish the underlying performance statistics that support these adjustments. As forecast resolution improves further, the linkage between recorded weather events and live odds movements is expected to tighten across both disciplines.