Cross-Sport Performance Correlations: Examining Metrics in Football, Tennis, and Racing
Kai Hoffmann · Aug 19, 2026

Cross-Sport Performance Correlations: Examining Metrics in Football, Tennis, and Racing
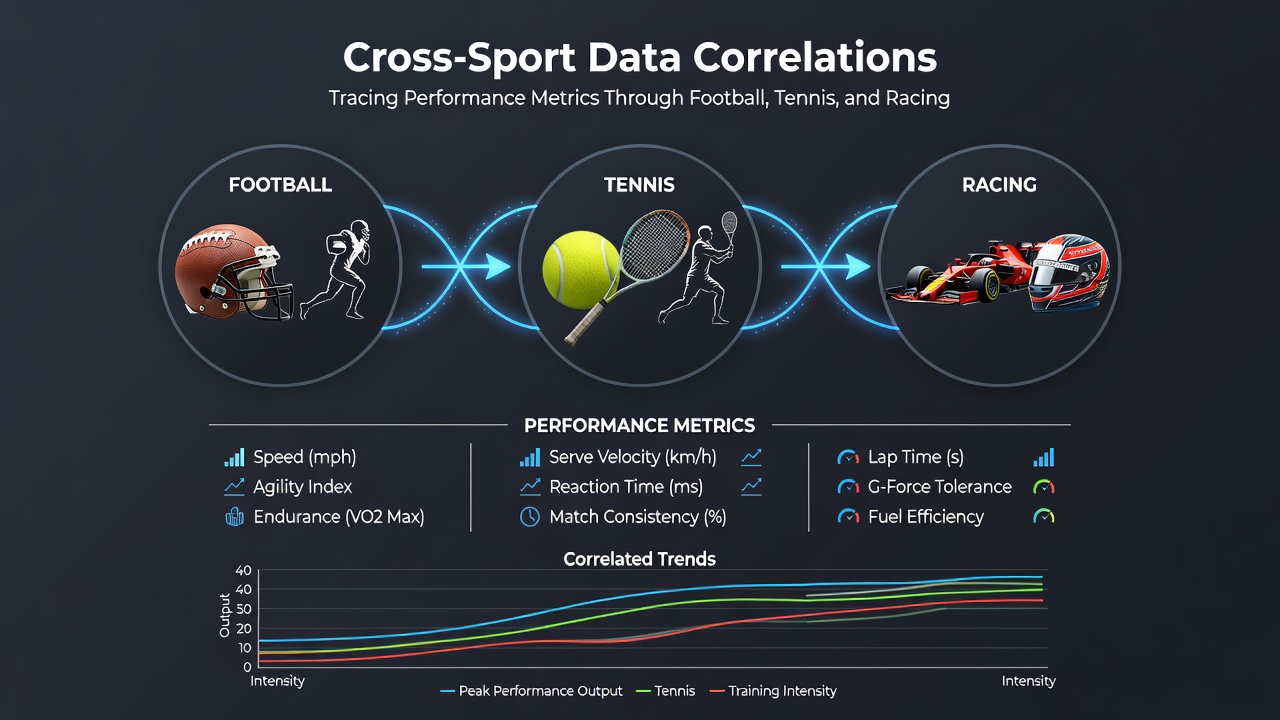
Researchers have traced patterns across football, tennis, and racing by comparing speed, endurance, reaction time, and recovery intervals, and these comparisons reveal measurable overlaps that analysts track through standardized testing protocols. Data from multiple seasons shows athletes in all three disciplines often share similar thresholds for sustained high-intensity output, while variations appear most clearly in recovery cycles that follow repeated bursts of effort.
Core Metrics Shared Across Disciplines
Football players log average sprint distances of 20 to 30 meters during matches, tennis competitors record comparable court coverage speeds during extended rallies, and racing drivers maintain peak reaction windows under 300 milliseconds in qualifying sessions, according to aggregated timing data compiled by sports science teams. Observers note that heart-rate variability remains a consistent indicator across the three, with elite performers in each field demonstrating lower resting rates during off-periods that correlate with faster return to baseline after exertion. Studies conducted through 2025 found that athletes maintaining sub-45-second lactate clearance times in controlled tests performed above average in match or race settings, a pattern that holds whether the subject competes on grass, clay, or asphalt surfaces.
Football Data Patterns and Cross-References
League-wide tracking systems record player workloads through GPS and optical cameras, and these datasets allow direct comparison with tennis rally lengths and racing lap segments. One analysis of European domestic seasons indicated that midfielders covering more than 11 kilometers per match also tended to post higher scores on repeated sprint ability tests, a metric mirrored in tennis players who sustain baseline-to-net movements over three-hour contests. Racing telemetry adds another layer, because drivers who manage tire degradation over 50-lap stints display similar pacing discipline to footballers who regulate energy across 90 minutes plus stoppages.
Tennis and Racing Overlaps in Reaction and Precision
Tennis serve speeds average 200 kilometers per hour at the professional level, while racing cornering forces demand equivalent neuromuscular precision from drivers, and researchers have documented parallel improvements when both groups incorporate reaction-light drills into weekly routines. Figures released ahead of the 2026 season highlight that players and drivers who improved first-step quickness by 5 percent or more also reduced unforced errors and lap-time variance in subsequent events. What's interesting is that grip-strength measurements taken during pre-season screenings show moderate correlation with both tennis stroke consistency and steering-wheel control under high lateral loads.
August 2026 Data Releases and Market Implications
Industry reports scheduled for August 2026 will incorporate expanded wearable sensor data from all three sports, and early previews suggest tighter confidence intervals around endurance-to-speed ratios than previous years. Organizations such as the Australian Institute of Sport have contributed longitudinal studies that track junior athletes progressing into senior competition, revealing that early identification of multi-sport aptitude often predicts sustained performance across codes. Parallel work from North American academic centers adds context by examining how collegiate training programs influence professional outcomes in football codes, individual racket sports, and motorsport feeder series.
Recovery and Workload Management Trends
Recovery protocols now integrate sleep-stage monitoring with training-load algorithms, and teams report that athletes who align their rest windows across seasonal calendars experience fewer soft-tissue issues regardless of primary sport. Data shows that a tennis player completing a five-set match and a racing driver finishing a two-hour grand prix both require roughly 48 hours before returning to full-intensity sessions, while footballers facing midweek fixtures follow nearly identical timelines when adjusted for total distance covered. Analysts cross-reference these timelines with market pricing models that adjust expectations based on recent workload spikes rather than isolated results.
Conclusion
Cross-sport datasets continue to expand through standardized collection methods, and the patterns emerging from football, tennis, and racing indicate shared physiological and technical demands that reward consistent monitoring. August 2026 releases are expected to refine existing models by adding granular positional and environmental variables, while regulatory and research bodies from multiple regions supply the foundational studies that keep these comparisons grounded in measurable evidence rather than isolated anecdotes.